High detail course maps
A street-legible image of the whole course, with every option on the form explained — a solid base for permit and council submissions.
A high detail course map is one large image of your entire course with every street name legible. It’s the starting point for the submissions race directors have to make — permit applications, police and council review, road-closure requests — and it’s also what you hand to volunteers and aid-station captains on race morning.
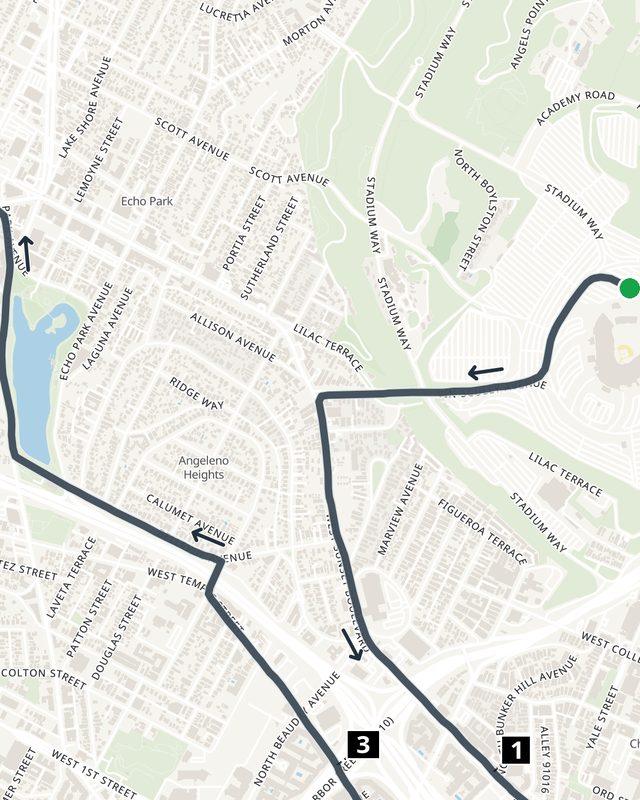
Worth saying plainly: every jurisdiction asks for something different, and some want details we can’t know about — marshal positions, closure times, a particular scale or form. We don’t claim this map satisfies your local requirements on its own. What it gives you is a strong, accurate base to build that submission on, instead of starting from a screenshot. If your office asks for more, download the file and add it on top in Canva, PowerPoint, or any image editor — or attach the map as the course picture alongside the office’s own forms.
New to map images? Start with Map images: which kind to make, which covers access, how to start one, and how long a render takes. This page walks through the form itself.
Starting one
Open a Race page and click Image in the toolbar, then choose High detail course map. Or go to Images in your profile sidebar and click Create.
If you came from a Race page the course is already filled in. Otherwise, search for one of your races or routes in the Course field at the top of the form. Click Change to swap it for another.
Choosing a course does two things: it loads your points of interest so you can pick which to mark, and it reveals the marker, distance and direction sections further down the form. That’s why parts of the page appear only after the course is set.
Name
Optional. This is how you’ll find the map later in your list — it isn’t printed on the map. Leave it blank and it takes the course’s name. Something like “2026 permit map” is more useful than the race name if you expect to make several.
Title on the map
Optional. Unlike the name, this is printed: in white capitals, in a black band across the top of the map, like the heading of a race-zone or road-closure sheet (“DOWNTOWN RACE ZONE”). Leave it blank for no band. A long title is set smaller so it fits across the page.
The band covers a strip along the top of the map. When you choose an area, the frame shows that strip, so you can keep anything that matters below it.
Map shape
The shape of the page the course is framed into:
- Fit to course — no fixed page shape. Frames the course as tightly as it allows, so the map is mostly course and very little margin. Good for looking at on a screen.
- Letter — portrait (8.5×11″) and Letter — landscape (11×8.5″)
- A4 — portrait and A4 — landscape
- Square (1:1)
- Widescreen (16:9)
Pick a paper size if the map is going to be printed or attached to a form — the image comes out at exactly that ratio, so it fills the page instead of leaving a band of white. North always stays up: choosing portrait pads the frame above and below rather than rotating the map.
Not sure? A long thin course (a point-to-point) usually wants landscape; a compact loop usually wants portrait.
What to show
By default the map shows the Whole course, with a margin of streets around it. Choose Choose an area to show only part of it instead — one sector of a city course, the start and finish area, or a neighborhood your police or marshals need on their own sheet.
A small map of your course opens with a frame on top. The frame has the shape of the page you picked under Map shape, so whatever is inside it fills the printed sheet. Move and zoom the map until the frame covers the area you want; the darker part outside the frame is left off. Change the map shape and the frame changes with it.
The course is drawn where it passes through the area and cut off at the edges, and markers outside the area are left off. To cover a whole course in sectors, make one map for each sector.
Map colors
Five palettes, shown with color chips on the form:
- Basic — white background, minimal color. Best for photocopying, and for anything that will be printed in black and white or faxed.
- Warm — warm paper with visible parks and water. The default, and the easiest to read.
- Bold — stronger color throughout. Best for open, rural courses where there’s little street detail to carry the map.
- Plain — black and white, streets only: no parks, land use or buildings, and water in light grey. The street names and your course are the only things on the page. Best for a road-closure or race-zone map for police, marshals and spectators.
- Primitive — black lines only, like a hand-drawn map: main roads and freeways as solid lines, smaller streets as dotted lines, and trails as grey dashes. Alleys, driveways and sidewalks are left out so the street grid stays clear. Pick a bright course color, such as magenta or red, so the course stands out from the black streets.
Course line width and color
Width runs Thin (3), Medium (5), Thick (8), Extra thick (12), Heavy (16), Extra heavy (20). Medium is the default and matches our interactive maps. The widths are pixels on the full-size image, so a map of a small area, such as one sector of a course, usually wants Heavy or Extra heavy for the course to stand out when the whole sheet is printed.
Bear in mind how the map will be used. A line that looks right on screen can disappear on a photocopy, and a course that doubles back on itself is easier to read with a thinner line. For color, either click the swatch or type a hex value such as #ef4444.
Markers
This section lists everything on the course that can be marked: the Start, the Finish, and each of your points of interest. Tick the ones you want drawn. Select all and Deselect all are at the top right, and points of interest are collapsed behind a count so a course with forty aid stations doesn’t bury the rest of the form.
Each ticked marker gets settings of its own:
- Shape — circle, square, triangle, or the point’s own map icon knocked out of the disk, so an aid station reads as an aid station. Start and finish markers can use any shape except the icon, since they have no icon of their own.
- Color — start markers default to green, finish to red, and points of interest to their own color.
- Checkered — fills the marker’s face with a checkerboard instead of a flat color, so it reads as a finish flag. It works on any shape but the icon, and it’s offered on every marker rather than the finish alone — useful where a lap ends partway round. Ticking it sets the marker black, which is the flag everyone knows, but you can pick another color.
- Show name — prints the point’s name beside the marker.
Names are worth turning on for a briefing map and worth leaving off for a dense urban course, where a dozen labels can hide the streets underneath.
If your start and finish are in the same spot, they’re drawn as one split square rather than two markers stacked on top of each other.
Distance markers
Labelled boxes along the course showing distance travelled.
- Interval — None, or every 0.5, 1, 2, 5, or 10.
- Units — miles or kilometers. Defaults to whichever your account uses.
Choose an interval that gives you something like ten to twenty labels. Every mile on a 5K is thin; every mile on a hundred-miler is unreadable.
Course direction
Arrows showing which way runners travel — worth adding to any map that goes to a permit office or a marshal, since a bare line doesn’t say which way people run.
- Style — None, Arrows beside the course, or Arrows on the course line.
- Interval — Auto (we space them for the length of the course) or a fixed distance.
- Units — miles or kilometers.
Arrows on the line read cleanly on a simple loop. Arrows beside the line are better where the course doubles back on itself, because they don’t sit on top of the second pass.
Generating
Click Generate preview. A progress bar names each stage — starting the tile server, building the map data for the area, fetching imagery, drawing the course. Give it a few minutes, especially the first time you map a new area, and use Email me when it’s done if you’d rather not wait on the page.
What you get
You land on the map’s own page. Hover the preview to magnify it, or click Inspect detail to zoom in and check that the street names where it matters are actually readable — worth doing before you buy.
The Print details card tells you what you’re getting: pixel dimensions, megapixels, file size, and the printed size at both 300 dpi (photo quality) and 150 dpi (usually plenty for a submission). If you need a specific printed size, this is the number to check.
What’s on this map lists the overlays you configured, so you can confirm the aid stations made it on without opening the file.
Every high detail map carries the line © OpenMapTiles © OpenStreetMap contributors in a corner. The map data we draw from is open, and crediting it is the condition of using it. On this kind of map the credit is printed on the image itself. (Decorative maps offer a box to take it off the image, which moves the credit to wherever you publish the map rather than removing the obligation.)
Free previews
You get 15 free previews per 24 hours. Try as many versions as you need; the allowance is only there to stop runaway rendering, and editing a map you already bought doesn’t count against it. If you do hit it, the page says when more become available.
Buying it
The preview is watermarked. A one-time $15 payment removes the watermark and unlocks the full-resolution, print-ready file for that course — and earns you $15 of credit toward a HelloDrifter subscription. See Buying, downloading, and updating a map image.
Changing it afterwards
Click Edit on the map’s page to reopen this form with your settings still in place. Change the color, the shape, which markers show — anything on this page — and generate again. It replaces the same map, so a purchase carries over.
Editing is free as long as it’s still substantially the same course. That’s the only condition, and it’s measured rather than guessed: if 80% or more of the course still overlaps the one you paid for, you can regenerate as often as you like at no cost — including after you’ve edited the underlying race or route to fix a stretch of the line or move an aid station. Change the course beyond that and it’s treated as a different course, which needs its own purchase. See Buying, downloading, and updating a map image.
The one thing you can’t change on this form is the course itself. To fix the GPS line or move an aid station, edit the underlying race or route, then come back and generate an updated map.
To make another map from the same settings, click Duplicate on the map’s page instead. The form opens with everything filled in — colors, page shape, line, markers, title and area — and the name marked “(copy)”. Generating makes a new map and leaves the first one as it is. This is the quick way to make a set of sheets: one sector of a course, then duplicate, move the area and change the title for the next. Because a duplicate is a new map, it has its own free previews and needs its own purchase to download.